This week’s homework was about loading and manipulating media. There were bonus points for not doing a video mirror or a sound board, so I decided I was going to avoid that.
To completely reduce the temptation, I wanted to load video clips instead of rely on webcam footage. Using the techniques Allison outlined in class, I wanted to address each pixel in these loaded videos to either display them or use their information to inform functionality.
I spent a lot, a LOT of time figuring out what videos would play nice with p5js. Many, many trips back and forth to and from Windows Movie Maker, cutting the length, shrinking the size, reducing the bitrate. I had a feeling that this might have been an issue with the online editor specifically, but in any case I was ready to deal with that limitation. After getting the video to play normally, I was ready to start analyzing each frame and draw.
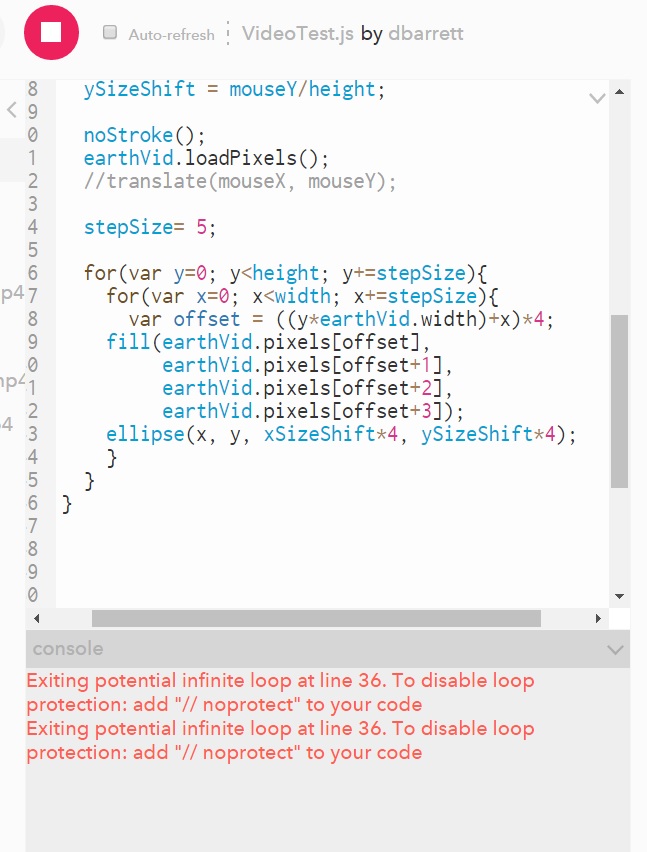
I was getting some inconsistent crashes with errors like these: “Exiting potential infinite loop at line 36”. It seemed to take issue with the for loops that were going through the frames, but it’s behavior was making me wonder if p5 was simply stalling out when faced with too large of a task. And now that I type this out, I realize that I haven’t had these errors with my desktop PC, only my laptop.
Being able to analyze the contents of the pixels and make decisions accordingly was of great interest. In playing around with what was possible, I wound up making somewhat of a ‘bonus’ sketch just to see if I could:
http://alpha.editor.p5js.org/projects/rktNzvLge
It isn’t pretty, it isn’t smooth, but it is technically a functional green screen.
With my meme break out of the way, I used my newfound pixel hunting abilities towards a more serious piece.
I have some NASA footage of a spaceship-level view of the earth. It needed to be downsampled a great amount in order for it to find it’s way into p5, but it wound up being ok for my purposes. This sketch loads the video, and then displays the video in a lower res field of dots. If you move your mouse, you can adjust the shape. As all sketches start with the mouse at 0,0, it can look like nothing at first and then dramatically stretch into view upon interaction.
Pixels in the video are analyzed and placed as circles. If the program detects that the given pixel is above a certain threshold of whiteness (in this case, the clouds), those white circles are larger than the ones that are not white. Then there is a “scan line”. It is an area defined in the sketch that is looking for these larger white dots. If there is a larger white dot detected in this area, it is highlighted with a green circle. A droning note is played with a different pitch depending on it’s location on the X axis.
http://alpha.editor.p5js.org/projects/rJ1peULee
There are still some bugs. As I moved development to my desktop, upon returning to the laptop it seems I cannot run the sketches. This is why I have added videos of the sketches running, just in case they cannot be seen on the presentation laptop. Also, when running smoothly, the NASA video sketch doesn’t always play the notes with the correct pitches. It appears that if you use the rate() and play() too rapidly in a row, sometimes the rate() command is ignored and the sound file is played at the original speed.
However, despite these setbacks, I am happy with the conceptual end result. I am interested in different ways to communicate data, and the idea of data “sonicalization” as opposed to visualization seems like an intriguing pursuit. Something like this could measure weather patterns, the health of a forest, or air quality conditions. The stylized output, visually and aurally, might create new opportunities to motivate people to digest these findings.
